MAKE A MEME
View Large Image

| View Original: | AsymptoticStabilityImpulseScilab.png (530x270) | |||
| Download: | Original | Medium | Small | Thumb |
| Courtesy of: | commons.wikimedia.org | More Like This | ||
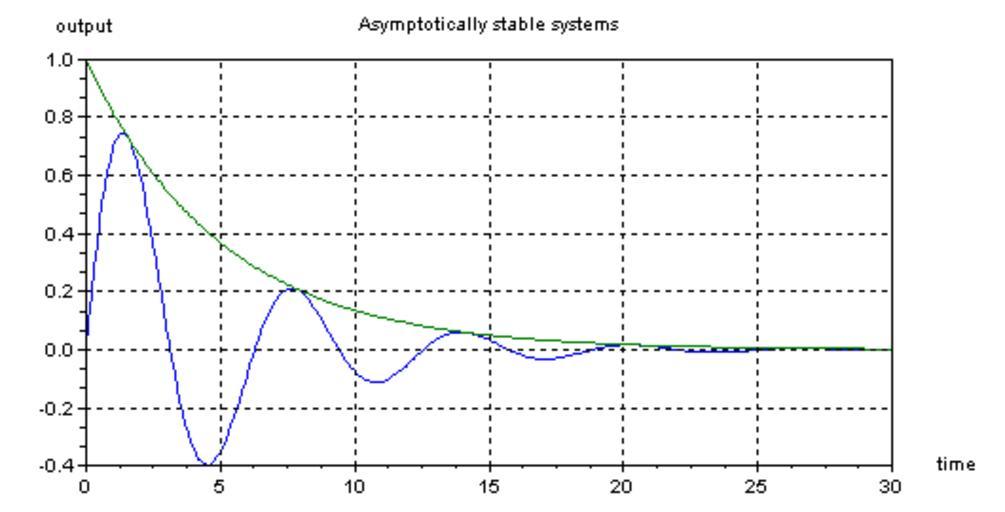
| Keywords: AsymptoticStabilityImpulseScilab.png en wikipedia 2012 May 21 impulse response for two similar asymptotically stable systems Green curve <math>y t e -\frac t 5 </math> Blue curve <math>y t e -\frac t 5 \sin t </math> Aside from formatting the following MATLAB code will generate this plot >> X 0 0 1 30; >> Y exp -X 0 2 sin X ; >> Z exp -X 0 2 ; >> plot X Y X Z ; Creation Info Created by me in Scilab www scilab org 24/10/05 Released into public domain with this upload Do with it what you will - Jenesis 21 57 24 October 2005 UTC 2005-10-24 Own Jenesis wikipedia en en wikipedia Jenesis Original upload log page en wikipedia AsymptoticStabilityImpulseScilab png 2005-10-24 21 56 Jenesis 530×270 4290 bytes <nowiki>Created by me in Scilab www scilab org 24/10/05 Released into public domain with this upload Do with it what you will </nowiki> Stability theory Dynamical systems | ||||