MAKE A MEME
View Large Image

| View Original: | BirthDeath 1950 BE.svg (480x280) | |||
| Download: | Original | Medium | Small | Thumb |
| Courtesy of: | commons.wikimedia.org | More Like This | ||
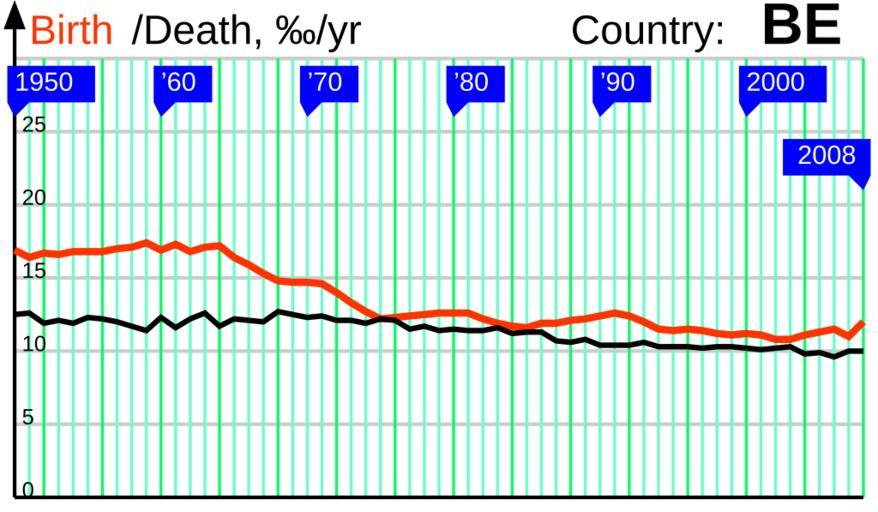
| Keywords: BirthDeath 1950 BE.svg en The birth and death rates in Belgium 1950 2008 ru Π ΠΎΠΆΠ΄Π°Π΅ΠΌΠΎΡΡΡ ΠΈ ΡΠΌΠ΅Ρ ΡΠ½ΠΎΡΡΡ Π² ΠΠ΅Π»ΡΠ³ΠΈΠΈ 1950 2008 own Incnis Mrsi 2009-07-14 public domain File RNI 1950 BE svg Disclaimer The author of this graph gives no warranty and accepts no responsibility for its factual accuracy This graph is nothing but a visualization of data from http //demoscope ru/weekly/ias/ias05 php tim 0 cou 4 terr 1 ind 26 Submit OK http //demoscope ru/weekly/ias/ias05 php tim 0 cou 4 terr 1 ind 1 Submit OK which may be incomplete or error-prone If you find an error please correct the data in a <path d ¦ /> tag adding some comments about your reliable source and upload the file over Temporal population graphs of Belgium Birth and death rates | ||||