MAKE A MEME
View Large Image

| View Original: | Brent method example.png (932x735) | |||
| Download: | Original | Medium | Small | Thumb |
| Courtesy of: | commons.wikimedia.org | More Like This | ||
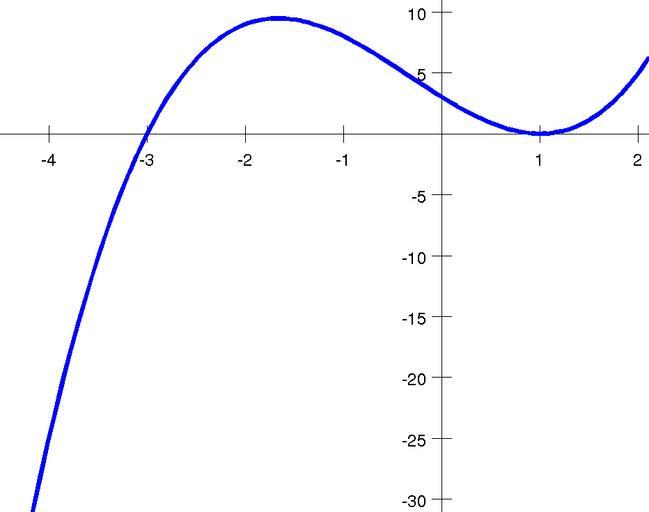
| Keywords: Brent method example.png Brent method example svg Graph of x + 3 x 1 <sup>2</sup> used to illustrate Brent's method Created by Jitse Niesen in Matlab Polynomial functions Matlab code <pre> f x x+3 x-1 2; xs linspace -5 2 5 ; ys f xs ; x-axis clf; hold on; plot -5 3 0 0 'k' ; for k -4 2 if k ~ 0 plot k k 0 7 -0 7 'k' ; text k -1 int2str k 'HorizontalAlignment' 'center' 'VerticalAlignment' 'top' 'FontSize' 12 ; end; end; y-axis plot 0 0 -35 15 'k' ; for k -30 5 10 if k ~ 0 plot 0 1 -0 1 k k 'k' ; text -0 15 k int2str k 'HorizontalAlignment' 'right' 'VerticalAlignment' 'middle' 'FontSize' 12 ; end; end; graph plot xs ys 'Linewidth' 3 ; axis -4 5 2 1 -31 11 ; axis off; print -dpng 'brent_tmp png'; system 'convert -trim +repage brent_tmp png brent png' ; </pre> | ||||