MAKE A MEME
View Large Image

| View Original: | Example Tauc Plot.jpg (565x360) | |||
| Download: | Original | Medium | Small | Thumb |
| Courtesy of: | commons.wikimedia.org | More Like This | ||
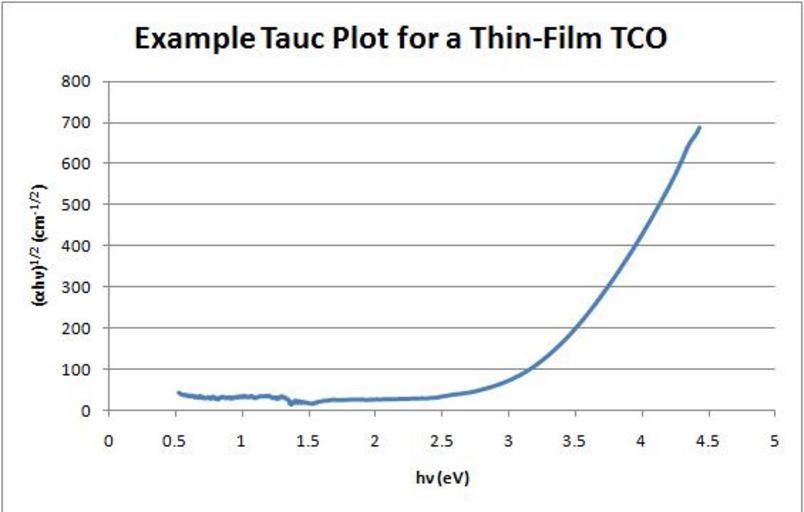
| Keywords: Example Tauc Plot.jpg en Typical Tauc plot for an amorphous thin-film transparent conducting oxide TCO Note the distinct linear region which can be extrapolated to the x-axis to determine the material's optical band gap own Mdw730 Plots Optical effects Band gap | ||||