MAKE A MEME
View Large Image

| View Original: | Gdp-and-labour-force-by-sector.png (1357x1256) | |||
| Download: | Original | Medium | Small | Thumb |
| Courtesy of: | commons.wikimedia.org | More Like This | ||
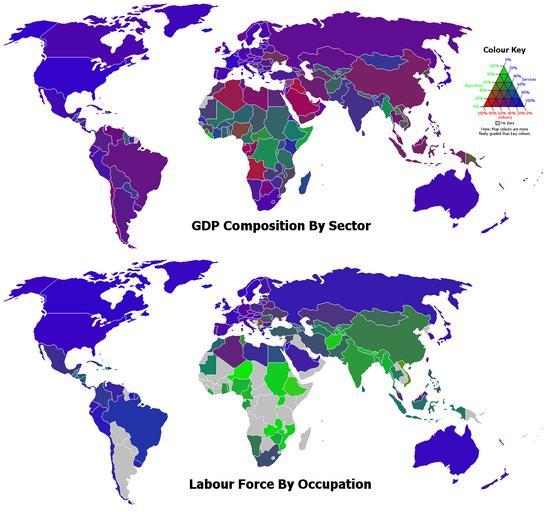
| Keywords: Gdp-and-labour-force-by-sector.png GDP Composition By Sector and Labour Force By Occupation produced using data from the CIA World Factbook 2006 The green red and blue components of the colors of the countries represent the percentages for the agriculture industry and services sectors respectively as summarized on the color key - for example rgb 102 51 201 represents 20 agriculture 40 industry and 40 services Own 2006-09-18 15 07 UTC Safalra Stephen Morley Economic maps of the world | ||||