MAKE A MEME
View Large Image
| View Original: | Japan's asset bubble.jpg (484x292) | |||
| Download: | Original | Medium | Small | Thumb |
| Courtesy of: | commons.wikimedia.org | More Like This | ||
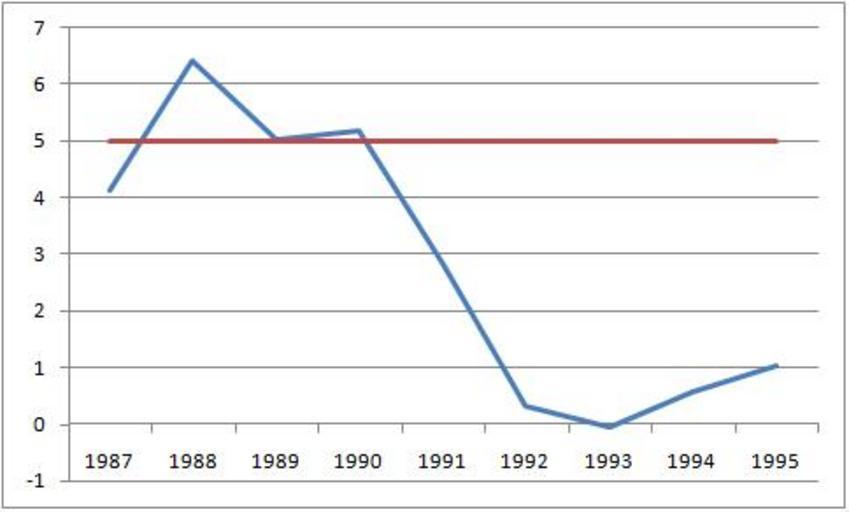
| Keywords: Japan's asset bubble.jpg graph en Blue line is Percent Change From Preceding Period in Real Gross Domestic Product Red line is Average GDP growth for Japan from 1950 “2000 Own JayHenry 2009-07-26 Economy of Japan | ||||