MAKE A MEME
View Large Image

| View Original: | Net energy cliff.gif (1516x812) | |||
| Download: | Original | Medium | Small | Thumb |
| Courtesy of: | commons.wikimedia.org | More Like This | ||
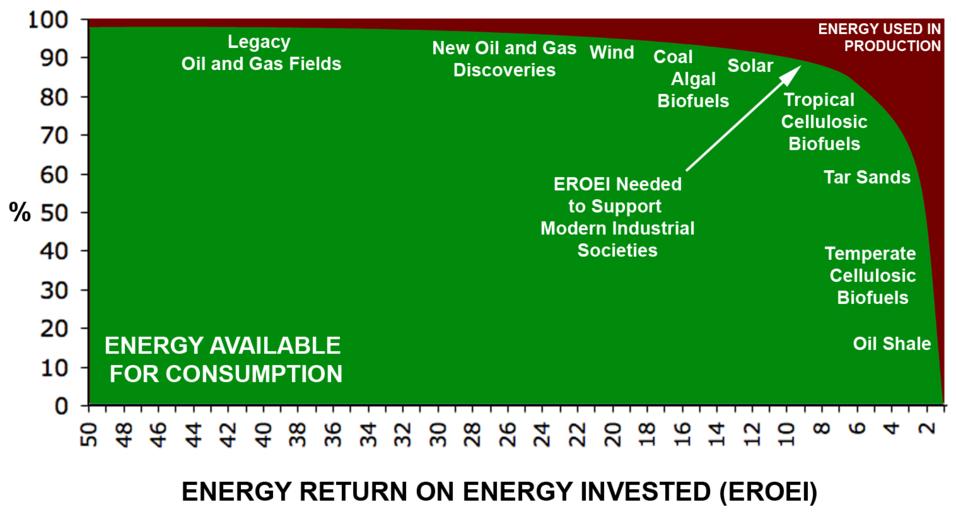
| Keywords: Net energy cliff.gif The Net Energy Cliff plot of Energy available for consumption y axis vs EROEI x axis different energy sources are pictured Coal Legacy/Modern/Future Oil and Gas fields Wind Solar etc As EROEI of modern fuels goes down more and more energy of the society is needed to extract new fuels Links http //www theoildrum com/node/8625 The Energy Return on Investment Threshold David Murphy on November 25 2011 en wikipedia 2009-12-24 Rodmadar wikipedia en Convert to SVG Rodmadar Original upload log en wikipedia Net+energy+cliff gif wikitable - 2013-03-10 20 30 1516×812× 75924 bytes Gunnar Kaestle Typo corrected Tropical - 2009-12-24 06 34 1542×938× 79841 bytes Rodmadar Arrow added for clarity - 2009-12-24 06 26 1542×938× 78413 bytes Rodmadar The Net Energy Cliff Uncategorized 2016 March 26 | ||||