MAKE A MEME
View Large Image

| View Original: | PcaIdea.png (700x700) | |||
| Download: | Original | Medium | Small | Thumb |
| Courtesy of: | commons.wikimedia.org | More Like This | ||
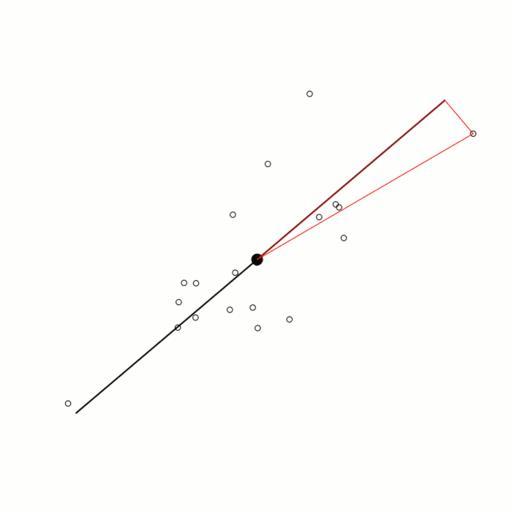
| Keywords: PcaIdea.png Visualize the idea of principal component analysis Own 2009-10-30 Sigbert <span class signature-talk >talk</span> 14 28 30 October 2009 UTC library mvtnorm library MASS set seed 09101964 s <- matrix c 1 0 8 0 8 1 nr 2 x <- rmvnorm 20 sigma s x <- sweep x 2 apply x 2 mean d <- sqrt x 1 x 1+x 2 x 2 pos <- which max d d <- max d pca <- princomp x eqscplot x axes F mx <- apply x 2 mean points x mx1 y mx2 pch 19 cex 2 psi <- min pca scores 1 psa <- max pca scores 1 p1 <- pca loadings 1 psi p2 <- pca loadings 1 psa pc1 <- matrix c p1 p2 nc 2 byrow T lines pc1 col black lwd 2 if -psi>psa p3 <- p1 else p3 <- p2 lines x c mx1 p31 xpos 1 mx1 y c mx2 p32 xpos 2 mx2 col red lwd 1 Created with R Statistics Mathematical diagrams Unidentified graphs Plots XY plots | ||||