MAKE A MEME
View Large Image

| View Original: | StandardDaisyWorldRun2color.gif (372x485) | |||
| Download: | Original | Medium | Small | Thumb |
| Courtesy of: | commons.wikimedia.org | More Like This | ||
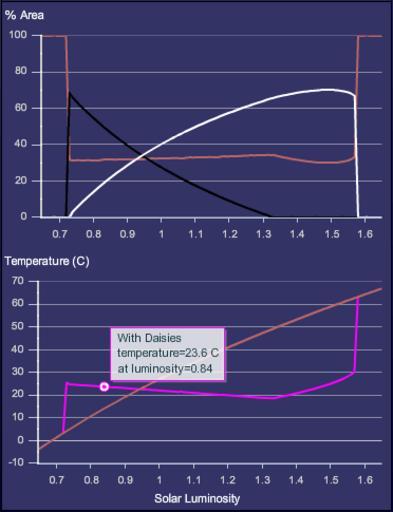
| Keywords: StandardDaisyWorldRun2color.gif graph en Plots from a basic DaisyWorld run with white and black daisies Top plot shows area covered with daisies or barren Bottom plot shows the planetary temperature achieved by daisy feedback pink vs what the temperature would have been if the planet were barren X-axis is solar luminosity Please see http //gingerbooth com/flash/daisyball to run the simulator own Ginger Booth 2010-10-19 Image generated by software at http //gingerbooth com/flash/daisyball I wrote the software Gaia hypothesis | ||||