MAKE A MEME
View Large Image

| View Original: | Wire Array B-field Strength.png (1150x766) | |||
| Download: | Original | Medium | Small | Thumb |
| Courtesy of: | commons.wikimedia.org | More Like This | ||
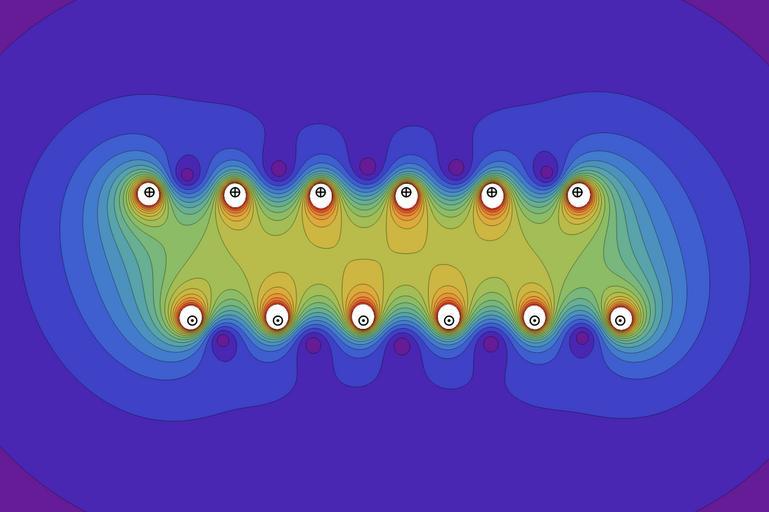
| Keywords: Wire Array B-field Strength.png A diagram of 12 staggered parallel wires that carry current through a plane in the direction indicated Plotted is the magnetic field strength resulting from this arrangement self-made Mathematica 09/11/2007 Inductiveload Mathematica Code <pre><nowiki> wireno 12; The number of wires wires Table i + 0 5 /1 5 -1 i i -wireno/2 wireno/2 - 1 ; This table contains the locations of the wires symbcircle xi_ yi_ rad_ Graphics White EdgeFormThick Disk xi yi rad ; cdot xi_ yi_ rad_ GraphicsDisk xi yi rad/3; ccross xi_ yi_ rad_ Graphics Thick Line xi - rad yi xi + rad yi Line xi yi - rad xi yi + rad ; iinsymbol xi_ yi_ rad_ Showsymbcircle xi yi rad ccross xi yi rad; Symbol for current going into the page ioutsymbol xi_ yi_ rad_ Showsymbcircle xi yi rad cdot xi yi rad; Symbol for current comng out of the page wiresinrad_ GraphicsShow Table iinsymbol wiresn 1 wiresn 2 rad n 1 wireno 2 ; Table containing positions of all in current symbols \ wiresoutrad_ GraphicsShow Table ioutsymbol wiresn 1 wiresn 2 rad n 2 wireno 2 ; Table containing positions of all out current symbols \ wiresymbolsrad_ Showwiresoutrad wiresinrad; All current symbols r xi_ yi_ Sqrt x - xi 2 + y - yi 2; Distance from x y to xi yi f xi_ yi_ y - yi /r xi yi 2 - x - xi /r xi yi 2 ; Circular vector field ftot Sum wiresk 2 fwiresk k 1 wireno ; Sum of effects of all wores including direction \ governed by y-positon cplot ContourPlot Sqrtftot1 2 + ftot2 2 Magnitude of resultant vecotr x -6 6 y -4 4 PlotPoints -> 50 PlotRange -> 0 6 01 We want a line at the top edge and this ensures it Contours -> Tablei/3 i 0 18 Frame -> False AspectRatio -> 4/6 ImageSize -> 1200 ColorFunction -> Rainbow ; Showcplot wiresymbols0 07 </nowiki></pre> Magnetic fields around conductors Solenoids | ||||